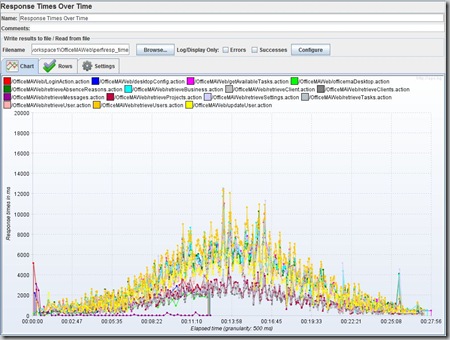
Apache JMeter is an Open source Java application designed to load test web applications and measure performance. A slight drawback is the limited number of results/graphs bundled with JMeter, but this is easily addressed by installing the JMeter Plugins which adds a wealth of graphs, for example Response times percentiles, Response times vs Threads, etc…, and functionality for example Stepping Thread Group to provide an incremental load profile.
The Performance Test
Now to the real business, how did I use it?, I have a Web application that runs in Tomcat 6 and connects to MySQL database which I needed to performance test. I utilized the following tools:
- VisualVM
- Apache JMeter
- JMeter Plugins
- Tomcat 6 running locally with APR
- MySQL 5 running locally
The test machine specs are: Intel Core 2 Duo T9300 @ 2.5GHz with 4.00GB RAM.
The Results
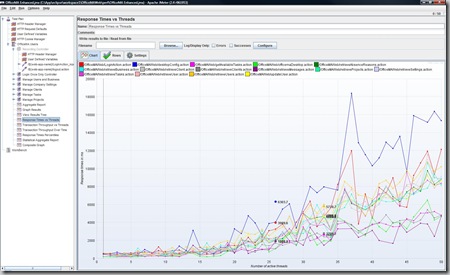
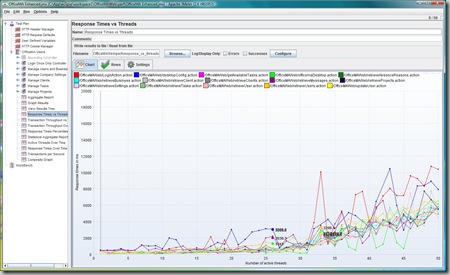
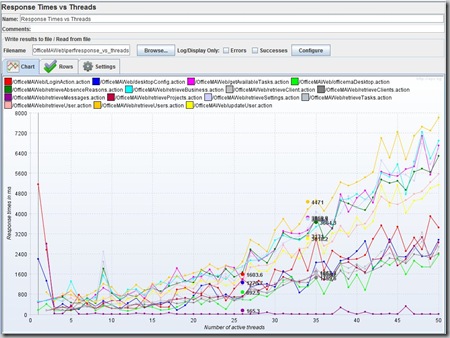
Initial tests using 50 JMeter users have highlighted a code problem that was blocking a number of Threads. I took a thread dumb using VisualVM during the peak load. The thread dump indicated an inefficient implementation of XML de-serialization which I then revisited and fixed, below is a comparison of response times vs threads before and after the fix:
Before
After
As seen from both graphs there are clearly some improvements to the response times.
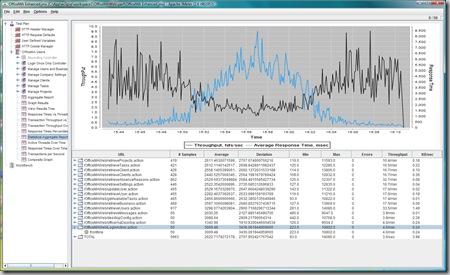
Another graph I investigated was the Statistical Aggregate Report. This graph also shows improvements in response times and throughput after the fix:
Before
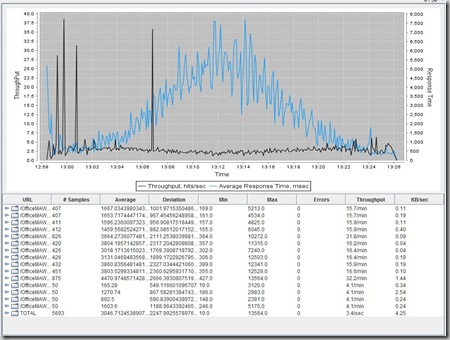
After
However, the report clearly shows that the response times increase with load whilst the throughput decreases with load, this indicates that the system does not scale very well as it’s. So next step was to try load balancing.
Performance Testing with Apache and Tomcat Load Balancing
Ok, next step was to try to load-balance two Tomcat instances using Apaches mod_proxy, this was tried on a Pentium 4 2.4GHz with 1.5GB RAM running Fedora Core Linux. And the results were promising as the Throughput is now stable, however response times were still increasing with the load profile:
Another thread Dumb at peak load have shown that the high response times were due to the blocking caused by the limited number of database connections in the database connections pool. With 50 Active users the database connections pool was set to the maximum of only 10 database connections so most requests reading data from the database had to wait for a free connection.
Next step is to increase the database connections pool size and to retest.
To be continued .
Last updated: 22/05/2015 – fixed the Jmeter-plugin links

