Contents
Google have recently introduced Cloud Shell to the Google Developers Console. Cloud Shell provides command-line access to Google Cloud Platform resources right from the browser. Cloud Shell is backed by an f1-micro Compute Engine instance running a Debian-based Linux OS and provides a 5 GB $HOME directory that persists across multiple sessions. The Cloud Shell VM instance terminates after an hour of inactivity.
Using Cloud Shell you can manage Compute Engine virtual machines, connect to Google Cloud services, checkout and compile code from Github, etc…, to mention but a few. All of this without having to install any software or SDKs locally, what’s more, Cloud Shell provides a Web Preview feature. You can run Web applications on your Cloud Shell on ports 8080 to 8084 then preview them on your browser through a secure proxy that is only accessible to your account.
In this post I will demonstrate how you can quickly build and test Docker images using the Google Cloud Shell. I will also show how these images can be deployed to Google Container Registry, a private Docker image storage on Google Cloud Platform. All the activities in this post were solely performed using the browser.
Introducing graphviz-server Web Application
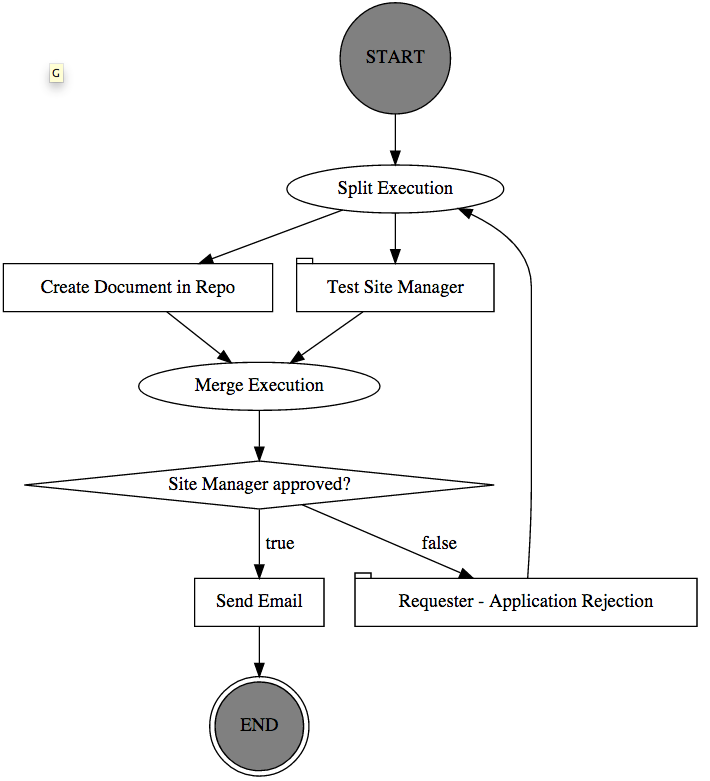
In the past I needed to generate graphs for various complex workflows (see the image below), one library that handles this very well is Graphviz. Graphviz is a powerful open source graph layout and visualisation tool. The graphs are specified in DOT language, which is a plain text graph description language.
Unfortunately there is no Java implementation of the Graphviz binaries. So, a sensible solution was to create a lightweight Java based HTTP server called graphviz-server to invoke the Graphviz binaries installed locally. This way I could have one graphviz-server serving all my applications that require graphs to be generated. This HTTP server accepts a POST request with the DOT text as its body, it then invokes the Graphviz binaries installed locally and returns the generated graph in SVG, PDF or PNG. In a previous post, I explained how this lightweight server and its dependencies can be installed on a Google Compute Engine VM.
The perfect use-case for a Container
Container technology makes it easy to run the the graphviz-server inside a container with all its dependencies pre-installed. This relieves us from the burden of having to install any additional software on the host operating system, apart from the software required to run the container of course. Here are the requirements needed to run the graphviz-server:
- Install the graphviz binaries,
- Install the Java Virtual Machine,
- Install Git, to checkout the source code,
- Install Apache Maven to build the source and generate an executable jar file and
- Clone the graphviz-server source from Github.
The Dockerfile
The following Dockerfile commands can be used to install these dependencies on a container image:
FROM ubuntu

MAINTAINER Omer Dawelbeit

# Update aptitude with new repo
# Install other software
RUN apt-get -y update && apt-get install -y \
   graphviz \
   default-jdk \
   maven \
   git

# Clone the graphviz-server github repo
RUN git clone https://github.com/omerio/graphviz-server.git \
   /opt/graphviz-server

# Expose port 8080 to the host
#EXPOSE 8080

# Set the current work directory
WORKDIR /opt/graphviz-server

# If you want to run maven to package the jar with dependencies yourself
RUN mvn package

# Run graphviz-server
ENTRYPOINT ["java", "-jar", "/opt/graphviz-server/dist/DotGraphics.jar"]
I will briefly explain some of the commands in the Dockerfile, first, in line 1 we start our image from a ubuntu base image, this is downloaded from Docker’s public central registry. Then in line 7 we install some of the graphviz-server dependencies using apt-get. On line 14 we clone the graphviz-server Github repository. We then set the working directory in line 21, then build the source using the maven package command in line 24. This will build the source and deploy a jar with dependencies to the dist folder. Finally we set the entry point of the container in line 27, this enables us to configure the graphviz-server container to run as an executable using a command in the following format:
docker run -d -p 8080:8080 graphviz-server 8080
The last argument which is port 8080 is supplied to the command on the container entry point, this will cause the graphviz-server to listen on port 8080. Now the 8080:8080 argument after the -p flag simply tells Docker to publish the container’s port 8080 to port 8080 on the host. The -d flag runs the container in the background in a “detached” mode. You can find more details about these flags here. Now we are ready to activate Google Cloud Shell and build this Docker image.
The Glorious Google Cloud Shell
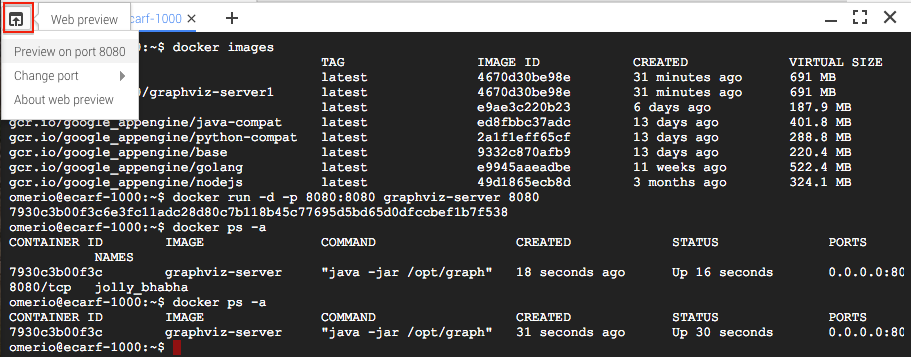
Once you login to the Google Developers Console, the Cloud Shell can be activated by clicking the icon outlined in the image below.
Once activated a console opens on the bottom of the page. We run the following commands to create a directory that contains the Dockerfile explained above. The cool thing about Cloud Shell is that it has the Google Cloud SDK, Docker and a few other goodies installed so we don’t need to setup anything.
mkdir graphviz-server
cd graphviz-server/
vi Dockerfile
Now we can build the Dockerfile by issuing the following command.
docker build -t graphviz-server .
Once the image is build we can verify it’s available locally by running
docker images
Pushing Docker Images to the Google Container Registry
We are now ready to push the graphviz-server Docker image to the Google Container Registry, this is a private and secure alternative to Docker’s public central registry. We need to push this image anyway because once the Cloud Shell session expires all images installed locally outside the $HOME directory will be lost. In order to use the Container Registry we need to first tag the graphviz-server with a tag in the following format gcr.io/your-project-id/example-image. More details are available on the Container Engine documentation. We run the following command to tag the image:
docker tag graphviz-server gcr.io/ecarf-1000/graphviz-server1
Then verify it’s actually tagged
docker images
Finally we push the image to Google Container Registry using the following command
gcloud docker push gcr.io/ecarf-1000/graphviz-server1
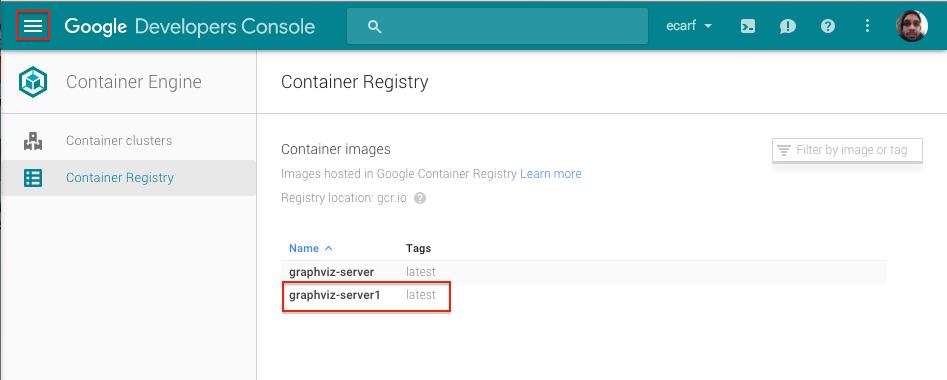
If we navigate to the Google Container Registry on the Google Developers Console, by clicking on the Gallery icon then clicking on the Container Engine option on the gallery. We can see our graphviz-server1 image is deployed as shown in the screenshot below.
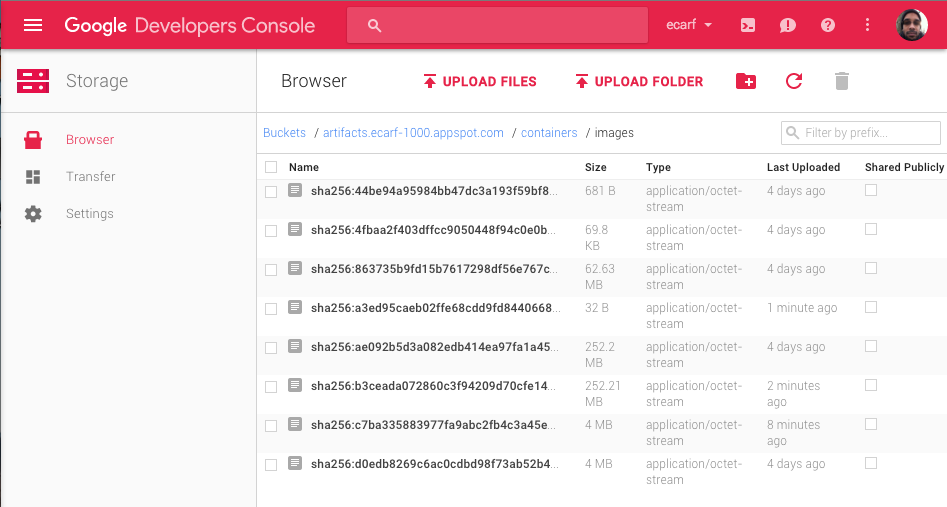
And if we navigate to the Cloud Storage browser you can see a bucket in the format artifacts.your-project-id.appspot.com is automatically created to store the image.
Running the graphviz-server container on the Google Cloud Shell
Going back to the Cloud Shell window, we can run the graphviz-server container by typing the following command:
docker run -d -p 8080:8080 graphviz-server 8080
We then type the following command to double check that the graphviz-server container is actually running:
docker ps -a
This means the graphviz-server is now listening on port 8080 of the container which is published to port 8080 of the instance running the Cloud Shell. Google provides a Web Preview feature which enables us to access port 8080 from the browser through a secure proxy. To do this we simply click on the Web preview icon then click on “Preview on port 8080”. This will open a new tab with a URL similar to this one https://8080-dot-1975544-dot-devshell.appspot.com/ and provide direct access to the Web application running on Cloud Shell:
Before we invoke the graphviz-server using this URL, we start a shell on the graphviz-server container:
docker exec -it 7930c3b00f3c bash
Then we simply tail the graphviz-server logs to verify that our requests are actually hitting the server:
root@7930c3b00f3c:/opt/graphviz-server# tail -f DotGraphics.log
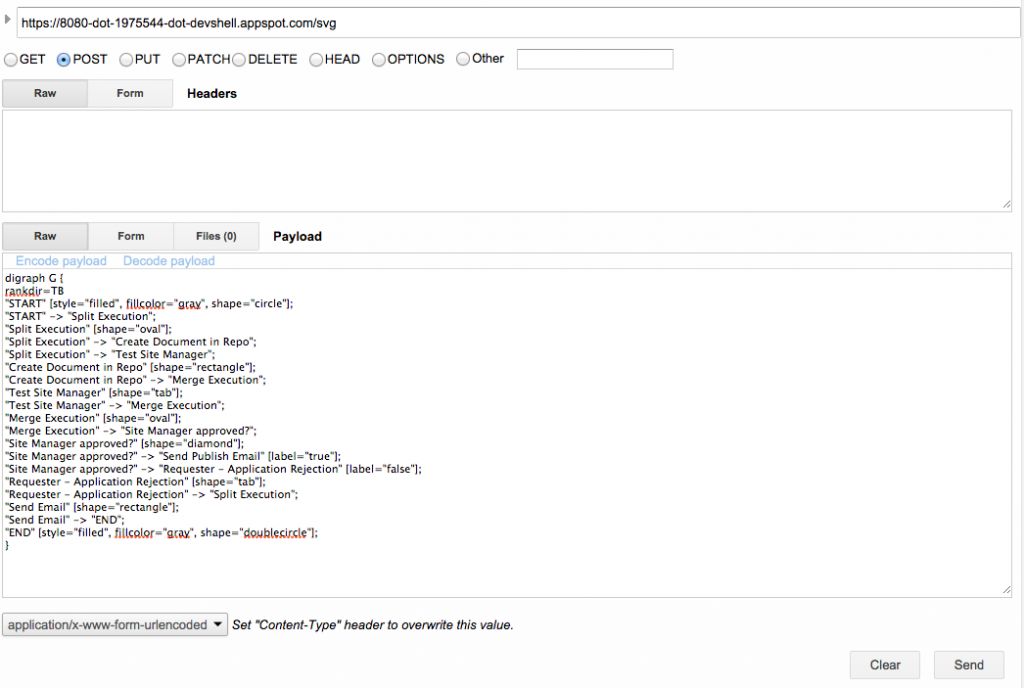
Using the Chrome Advanced Rest Client plugin we can POST the following DOT graph to the server using the Web preview URL https://8080-dot-1975544-dot-devshell.appspot.com/svg and the graphviz-server nicely responds back with the SVG graph shown above.
digraph G {
  rankdir=TB
  "START" [style="filled", fillcolor="gray", shape="circle"];
  "START" -> "Split Execution";
  "Split Execution" [shape="oval"];
  "Split Execution" -> "Create Document in Repo";
  "Split Execution" -> "Test Site Manager";
  "Create Document in Repo" [shape="rectangle"];
  "Create Document in Repo" -> "Merge Execution";
  "Test Site Manager" [shape="tab"];
  "Test Site Manager" -> "Merge Execution";
  "Merge Execution" [shape="oval"];
  "Merge Execution" -> "Site Manager approved?";
  "Site Manager approved?" [shape="diamond"];
  "Site Manager approved?" -> "Send Email" [label="true"];
  "Site Manager approved?" -> "Requester - Application Rejection" [label="false"];
  "Requester - Application Rejection" [shape="tab"];
  "Requester - Application Rejection" -> "Split Execution";
  "Send Email" [shape="rectangle"];
  "Send Email" -> "END";
  "END" [style="filled", fillcolor="gray", shape="doublecircle"];
}
In my next blog post I will be looking at Google Container Engine and I will be explaining how we can use it to deploy and scale a cluster of graphviz-server containers. Stay tuned.

