Introduction
Contents
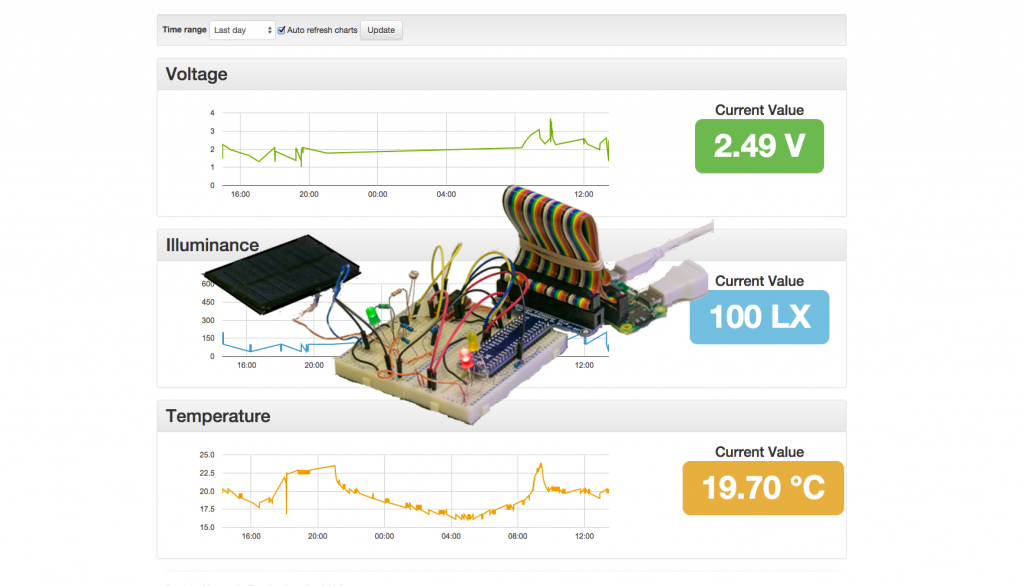
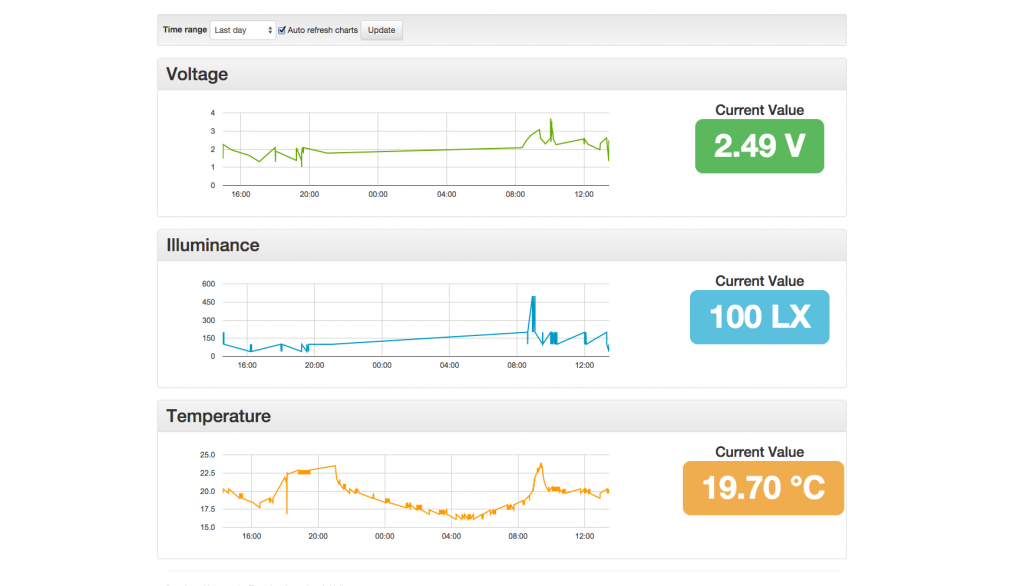
In this article I’m going to explain how you can setup a real time sensors dashboard using Google App Engine and a Raspberry Pi Zero. Here is a live demo and the video below shows the end result. If this sounds interesting, then read on for the details.
Google App Engine is a Platform as a Service (PaaS) that lets you deploy and run your applications on the Google infrastructure without having to worry about setting up your own hardware, Operating System or server. We will also use Google Charts — free, powerful and simple charting tools — to plot the sensors data into line charts. We have also used Initializr — a HTML5 templates generator — to generate a template for the dashboard which includes Bootstrap, jQuery and other useful frontend resources.
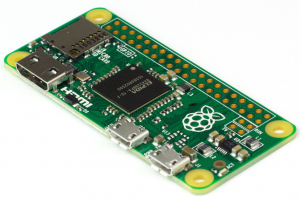
For the hardware we will use the glorious Raspberry Pi Zero, a fully fledged computer smaller than a credit card. The Pi Zero features a 1Ghz single-core CPU, 512MB RAM, mini HDMI and USB and a 40 pin GPIO header. We will connect a few sensors to the GPIO pins and send their data over to Google App Engine. When user views the dashboard both the values and charts on the dashboard update in real time whenever new data arrives from the sensors. The source code for both the App Engine dashboard and the Pi Zero app is in Github with instructions on how to build and deploy each project.
Architecture Overview
In this article we use Java as the programming language, Java is supported by both Google App Engine and the Pi Zero through the Pi4J library. However, if you prefer you can easily rework the code into Python, which is also supported by both the Pi Zero and Google App Engine. The new versions of the Pi Zero Operating System, Raspbian, comes with Oracle Java 8 pre-installed. Ultimately we deploy and run an executable JAR on the Pi Zero, this JAR reads the input from the sensors and updates Google App Engine. We use Apache Maven to compile and build the code on the Pi Zero, although this is not necessary as you can build the code on your laptop and copy the JAR over to the Pi Zero.
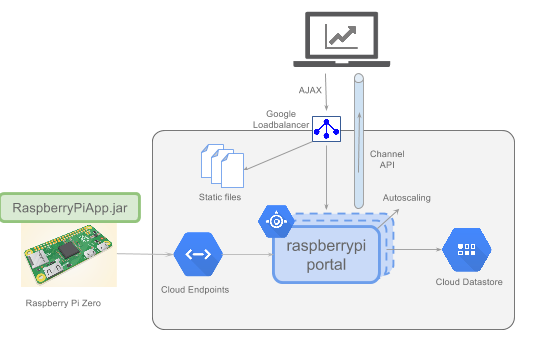
The full architecture is shown below:
On the Google App Engine side we use Cloud Endpoint, a very powerful service that we can use to create a backend API and client libraries for mobile and web by using annotations. Since the generated Android client is Java based we can use it with the Pi Zero application. The API that the Pi Zero calls is authenticated using Google OAuth 2.0 for installed applications. We use an authenticated API to ensure that only our authorised Pi Zero is actually able to send updates to the server. We also use the Channel API, one of the Google App Engine services that enables us to establish a persistent connection between the browser and the server so we can push real time messages to the browser. This is obviously better than continuously polling the server for updates.
The Hardware
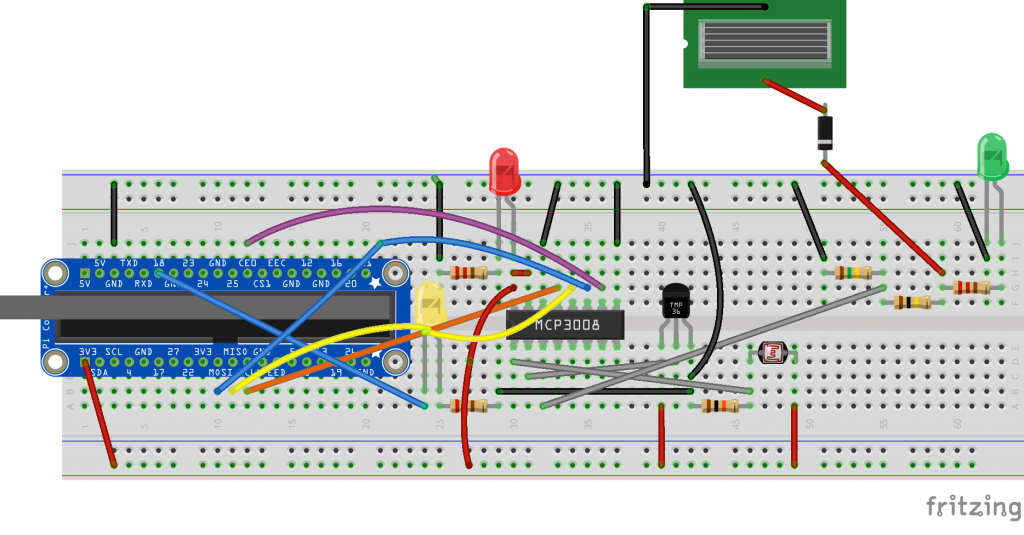
The hardware we are building in this article is basic and is inspired from other online articles. Instead of repeating the setup here I will reference these articles where appropriate. Here is the Breadboard view of the completed circuit generated using Fritzing. If you install Fritzing you can download this schematic here:
I need help with the hardware
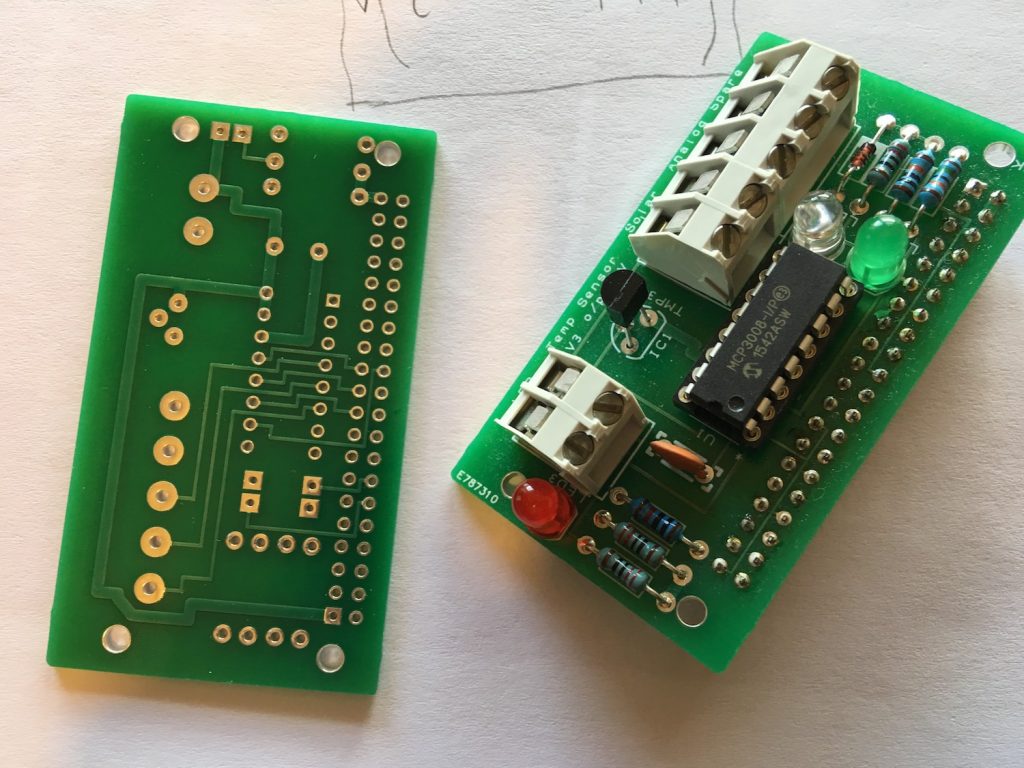
For the hardware used in this article, my friend Lez has created a bare board and a populated board which can be purchased on his Website. You can use the bare board instead of a breadboard, source and solder the components yourself. The populated board comes with all the components apart from the solar panel and the photocell (LDR), which are mentioned below and can be bought from Amazon.
I want to assemble the hardware myself
The purpose of this hardware is to provide the readings of three sensors, voltage from a solar cell, temperature from an analogue temperature sensor and illuminance (LUX) using a photocell. Because the output of the temperature sensor and photocell is analogue and the Pi Zero only accepts digital input, we use an Analogue to Digital Converter (ADC).
Here are the components used:
- Resisters: 3 x 220Ω, 1 x 10KΩ, 1 x 100KΩ and 1 x 150KΩ
- General purpose diode (for the solar cell)
- Three LEDs (red, yellow and green)
- Generic photocell
- Analog temperature sensor: Adafruit TMP36
- Mini solar cell 6.5 x 6.5cm 5.5v 90mA 0.6W
- Analogue to Digital Converter: Adafruit MCP3008 8-Channel 10-Bit ADC With SPI Interface
- Raspberry Pi 40 pins coupler and cable
- Breadboard
- Raspberry Pi Zero with official WiFi dongle and adapter kit.
If you use the Pi Zero then you need to solder pins on the unpopulated GPIO headers. We use the 3.3v pin 1 on the Pi Zero to power our various components. We use a red LED connected to the Pi’s 3.3v pin as an indication of power, a green LED as a load for the solar cell and a yellow LED to indicate when the Pi is saving data to the cloud. The yellow LED is connected to pin 18 on the Pi Zero. All LEDs are connected to 220Ω resistors.
Connecting the Sensors
Since all the three components, temperature sensor, photocell and solar cell output analogue voltage between 0 and 3.3v, we use the MCP3008 ADC to convert these analogue voltage values into digital values between 0 and 1023. This is because the MCP3008 is a 10 bit ADC and the largest decimal number you can represent with 10 bits is ![]() . The MCP3008 ADC has 8 input channels, which means we can connect up to 8 analogue inputs to it. The MCP3008 uses the Serial Peripheral Interface (SPI) for communication, which is already supported by the Pi Zero. Bear in mind to program the MCP3008 ADC we need to understand the structure of the data that should be sent to it, these are explained on the datasheet on page 21. The Pi Zero code is full of comments that explains why particular values are being sent to the ADC.
. The MCP3008 ADC has 8 input channels, which means we can connect up to 8 analogue inputs to it. The MCP3008 uses the Serial Peripheral Interface (SPI) for communication, which is already supported by the Pi Zero. Bear in mind to program the MCP3008 ADC we need to understand the structure of the data that should be sent to it, these are explained on the datasheet on page 21. The Pi Zero code is full of comments that explains why particular values are being sent to the ADC.
We connect the photocell to channel 0, the temperature sensor to channel 1 and the solar cell to channel 2, this leaves the other 5 channels free. The photocell and temperature sensor connections used here are the same as in this raspberrypi-spy article, so we won’t repeat this setup here. Be sure to follow this article on the same website to enable the SPI interfaces on your Pi.
Temperature
The temperature formula we use for the TMP36 is based on the one on this article on the Adafruit website:
millivolts = read_adc0 * ( 3300.0 / 1023.0 )
temp_C = ((millivolts - 100.0) / 10.0) - 40.0
Illuminance
Again, to measure the illuminance we use a lookup table based on these values on the Adafruit website, bear in mind these are just an approximation because we are using a generic photocell without the datasheet. If you want more accurate LUX readings then it’s better to use a digital LUX sensor.
Voltage
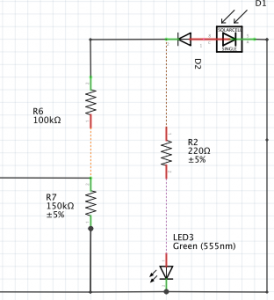 For the solar cell a diode is connected to its positive terminal as described here. Additionally, because the cell can produce a maximum of 5.5v we use a voltage divider to ensure the ADC receives only 3.3v when the cell output is at its maximum (5.5v). The circuit on the left show the solar cell with resister R2 = 220Ω and Green LED3 as load. We then use R6 and R7 as voltage divider so that we can calculate the cell output voltage
 ![]() from the voltage read by the ADC
from the voltage read by the ADC ![]() using this formula:
using this formula:
![Rendered by QuickLaTeX.com \[ V_{in} = \frac{V_{out} * (R_6+R_7)}{R_7} \]](https://omerio.com/wp-content/ql-cache/quicklatex.com-f2166c8676161b97cc40b43db479acc3_l3.png)
This circuit for measuring the solar cell voltage is inspired by this article, which includes the wiring and the formula for measuring the current as well. This article on RasPi.TV for measuring the voltage output of a 2 cell lithium polymer (lipo) battery is also useful. Here is the fully assembled Breadboard and Pi Zero:
The Dashboard App
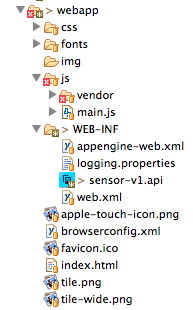
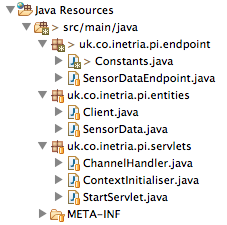 The dashboard app is a simple Java Web application that is deployed to Google App Engine. The source code is located in Github. Here we will provide a brief review of each of the key files. The instructions on how to deploy the application are on Github, simply follow them to get your own dashboard up and running on Google App Engine.
The Java classes are organised in three packages, the endpoint package contains the sensor data API class. The entities package contains the objects that we persist to the Datastore (the App Engine NoSQL database). The servlets package contains the Java web application servlets. The most important class is the SensorDataEndpoint.java that implements the sensor data API.
The Sensor Data API
The sensor data API is coded using Cloud Endpoints and implemented in SensorDataEndpoint.java shown below. As you can see we have created a fully fledged API by using annotations such as @Api on line 23 and @ApiMethod on line 37. Google App Engine will expose the create method annotated with @ApiMethod as a REST/RPC API that uses JSON over HTTP. The client libraries for Android and iOS can also be created by the user.
When the Pi Zero calls this create method, Google App Engine will populate and inject a User object if the Cloud Endpoint request was authenticated using a valid Google Account. If not, we throw some exceptions, otherwise we go ahead and save the SensorData object. Note that App Engine is doing the marshalling and unmarshalling of the SensorData object from JSON to Java and vice versa. Next step on line 55 we use the App Engine Channel API to notify any connected clients (browsers) that we have new data. We retrieve all active clients from the Datastore and update each of their channels.
HTTP Requests Handlers
When a user loads the dashboard into their browser the JavaScript makes an AJAX call to /getdata, this is mapped to the StartServlet.java.
This servlet will use the HTTP session ID to determine if the user has a Client entity saved in the datastore, which mean they already have an open channel. If not, then a new Client entity and a channel are created, the HTTP session ID is used to generate a channel token, which is sent to the client. The JavaScript uses this token to establish a channel connection and registers a handler which is invoked when messages are received. The servlet then retrieves the sensor data for the last X minutes and sends a response back to the client as JSON.
The ChannelHandler.java class handles channels connection and disconnection, whenever a new client connects to or disconnects from a channel this handler is invoked. When a client disconnects we use this handler to remove their corresponding Client entity from the datastore, so we don’t have to worry about updating their channel anymore.
The Frontend Code
The bulk of the frontend code is in main.js, in here we make an AJAX call to get the channel token and a list of sensor data for the last X minutes. Once we get the data from App Engine we reformat it so that it’s suitable for the Google Line Chart. We then use the channel token to establish a channel connection and register an event handler for when channel messages are received.
The user interface offers the user three charts with the ability to retrieve data for the last minute, hour, day and 30 days. The user can also choose to auto refresh the charts when new sensor data is received through the Channel API. We use the jQuery Animate Number plugin to add a nice effect when new sensor values are received.
The Raspberry Pi App
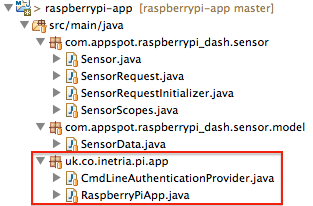
The Raspberry Pi app is a Java JAR with an executable main class. The source code for the app is in GitHub. The app consists of a bunch of Java files, the files highlighted in red are the ones we’ve created. The other classes are automatically generated by the App Engine Cloud Endpoints utility and we just copied and pasted them in the app. These classes represent the Cloud Endpoints client that the Pi is going to call when it’s sending sensor data to App Engine.
The CmdLineAuthenticationProvider.java file provides the implementation for an OAuth 2.0 installed client. When the application is started from the command-line for the first time it asks the user to type in a URL into their browser:
$ java -jar RaspberryPiApp.jar
Please open the following address in your browser:

https://accounts.google.com/o/oauth2/auth?client_id=111109056482-6jn34uijapemnbfk4k7ukcv7eclse1ln.apps.googleusercontent.com&redirect_uri=urn:ietf:wg:oauth:2.0:oob&response_type=code&scope=https://www.googleapis.com/auth/userinfo.email
Attempting to open that address in the default browser now...
Please enter code: afdsadsfasdfawikehUzIMoSTk9hZ96VkFMbZA0
Once the URL is opened on the browser, it will forward to the Google accounts ‘Request for permissions’ page. We need to be signed into a Google account and accept the request. A short code will be generated which we then need to copy and paste into our Pi app as shown in ‘Please enter code:‘ snippet above. Once that is done, the application will now exchange this code for an OAuth 2.0 token that can be used to make requests on our behalf.
The RaspberryPiApp.java is where everything else apart from authentication takes place. Here the values of the sensors are read and sent over to Google App Engine using Cloud Endpoints. The two noteworthy methods are shown below. readChannel, sends 3 bytes to the MCP3008 chip using the SPI interface and gets back 3 bytes, from which we extract 10 bits. The logic is explained in the comments below, uses Java bitwise operators and is based on the Python code in this article. The other sendSensorData method uses the Cloud Endpoints clients to send the sensor data over to Google App Engine.
Summary
In this article we have presented a full working solution for implementing a real time sensors dashboard (https://raspberrypi-dash.appspot.com/) on Google App Engine Platform as a Service. We have used the following Google App Engine Technologies:
We have also used Google OAuth 2.0 to authenticate updates from our Raspberry Pi Zero. On the frontend side we have used Bootstrap, Google Charts and jQuery. For the Raspberry Pi, we have tested this app on Pi Zero and used the Pi4J library to be able to interact with the GPIO pins using Java.
Where to Next
You can deploy and run both applications as detailed in GitHub, you can also modify both the dashboard and Pi code to suit your need:
- App Engine Dashboard: https://github.com/omerio/raspberrypi-appengine-portal
- Raspberry Pi App: https://github.com/omerio/raspberrypi-app
If you are interested in implementing Internet of Things (IoT) solutions on the Google Cloud Platform, or wondering about the best architecture to follow then make sure to checkout the IoT documentations.

